Improving Baxter Robot Catch Success with Neural Nets
2016-06-06 00:00:00 +0000
Team: Claire Melvin (melvinclaire@gmail.com), Minghe Jiang (minghej@u.northwestern.edu) and Rikki Irwin (rikkiirwin@gmail.com)
Overview
The goal of this project was to predict the success of a robot throwing task based on features of the throw such as release state and throw path. This project was for the class EECS 349: Machine Learning at Northwestern University. Data collection, feature selection, algorithm testing and algorithm tuning were all worked on by all members of the team.
Our task is to predict the success of a robot throwing task (seen in video below) based on features of the throw such as release state and throw path. A fundamental task in robotics is to design feasible trajectories that determine control inputs to drive a robot from an initial configuration and velocity to a goal configuration and velocity while obeying physically-based dynamic models and avoiding obstacles in the robot’s environment. Such a trajectory planner has been implemented by our teammate Rikki in a previous project, but the success rate of the current algorithm is about 80%. The failures are unexpected, and there is no clear correlation between the robot joint paths and failure. Through the machine learning project described in this report, the success of the trajectory planner is improved by discovering which features are important and how they affect the success of the throw.
The data for this task was collected by running 606 throw trials, each of which took approximately 30 seconds to run. At each trial, the relevant parameters and path variables were automatically extracted and recorded as sample features. The operator was prompted to input throw success. Features consisted of measures of the throw path, like maximum joint velocity over the throw, and measures of the desired throw position, like lateral position. This dataset was then used to predict whether a throw achieved catch success.
Upon testing multiple algorithms (clustering, Bayes nets, regrssion, and neural networks), we found that multilayer perceptrons performed with the highest accuracy. We examined feature contribution to find that features describing the maximum velocity and position of each joint of the robot contributed the most to the model’s success.
Our machine learning solution performed better than expected. Our aim was to achieve 85% classification accuracy upon implementation on an algorithm. Key findings showed that features relating to the robot’s physical limits had a high correlation with catch success, and by focusing on these features we were able to increase our overall accuracy. With a pruned feature set and tuned parameters in the neural network, we achieved 85.71% classification accuracy on the training set through 10-fold cross validation. With this same model we achieved 87.5% classification accuracy on the set-aside test data. By applying this classification algorithm to a calculated throw path before the throw is executed, the final algorithm increases our overall throw success rate from 80% to 96.55% (greater than 75% error reduction in missed throws).
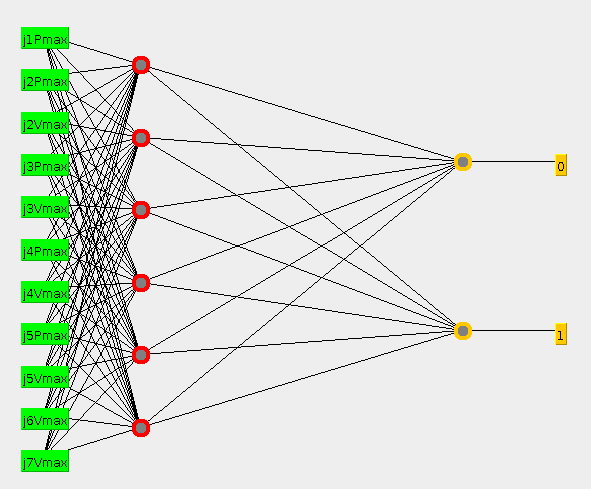
Visualization of multilayer perceptron model
This figure shows a visualization of our multilayer perceptron neural net model.
Data
In previous work, our teammate Rikki developed an algorithm to generate the throwing path. For this task, we expanded on the implementation to extract relevant features by calculating and recording information about the release point and the path that is taken to get there. The release point is specified by four variables: the lateral position and velocity and the vertical position and velocity. We transform these measures into joint space of the robot’s arm using the Jacobian transformation to give position and velocity of the seven arm joints. We also extract features about the path taken during the throw, from the fixed starting position to the calculated release position. We look at execution time and number of discrete steps in the path. We also look at the following metrics for each joint: maximum angle, minimum angle, absolute maximum velocity, absolute maximum acceleration, and distance from joint and velocity boundaries. In total we evaluated 69 features. In the final implementation, we use only 11 of these features to classify the test data.
We collected 606 samples of throwing data (features and catch success status). We partitioned the data into 406 samples for training and 200 samples for testing. We did not explicitly designate a validation set as we used 10-fold cross validation to evaluate our algorithms.
Methods
The steps we applied for achieving a high accuracy machine learning algorithm were:
- Determining appropriate algorithms
- Evaluating features by domain knowledge
- Evaluating features by statistical correlation
- Tuning parameters
In all of our analysis we used WEKA to implement the algorithms.
Determining appropriate algorithms: In this step, we determined algorithms which would likely perform well with our dataset using information we learned from lectures. We created models to test our data set using clustering, regression, bayes nets, and neural nets. We evaluated these models on accuracy, training time, true and false positive rates, and precision. The neural net model outperformed the other models in every regard besides training time, so we chose this model to further analyze.
Evaluating features by domain knowledge: In this step, we eliminated features that did not provide information to the learning task based on domain knowledge. By visually examining each feature versus catch success in WEKA, we eliminated 29 features from the dataset wherein the majority of samples fell within a very narrow range. For example, the data for Joint 1’s position minimum fell within -.225 and -.223 radians for 476 samples out of 506; we therefore eliminated this feature and others like this because they did not contribute any new information to the classification task. When these values are too similar, the data is not linearly separable and these features were of little beneficial use for many of the classification algorithms.
Evaluating features by statistical correlation: In this step, we methodically eliminated unimportant features using feature correlation tests. We tested in three ways: first, by testing one feature at a time and measuring root relative squared error. Second, by removing one feature at a time and measuring accuracy. Third, by splitting the features into groups of similar information and testing the accuracy of one group at a time. This step became the key to our successful implementation.
Tuning parameters: In this step, we used the information from our statistical correlation tests to tune parameters and find the best performing algorithms. We tested and tuned three sets of data: first, all features with a root relative squared error less than 100%. Second, by eliminating features whose removal caused an overall increase in accuracy in our statistical correlation tests. Third, by using only features from groups whose accuracy was higher than the initial accuracy. This third group consisted only of position and velocity maximum values for each joint and with no tuning gave an accuracy of 84.48%. After tuning the model parameters, it reached an accuracy of 85.71%.
Training and testing accuracy with varying model parameters
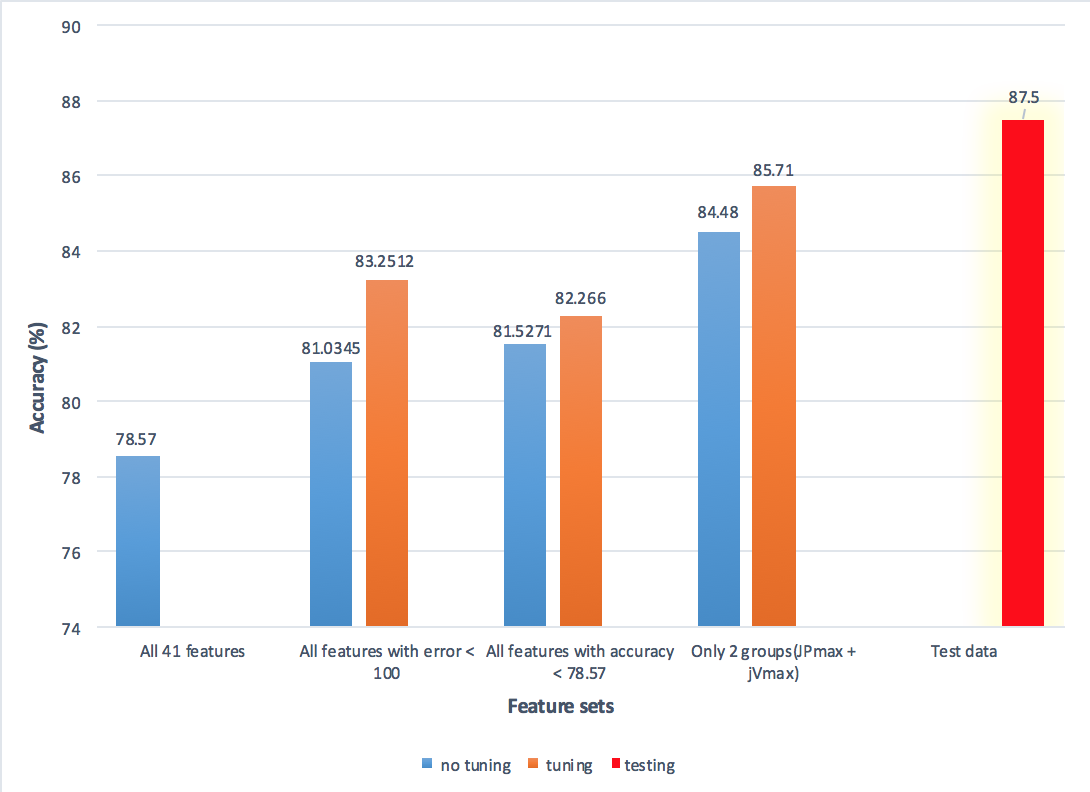
This figure illustrates the classification accuracy achieved through 10-fold cross-validation by our three feature groups, before tuning (blue bars) and after tuning (orange bars). The first blue bar shows 10-fold cross-validation accuracy with all the features and no tuning. The red bar shows the classification accuracy achieved on the test data by our highest scoring cross-validation model.
Results
By evaluating the features using domain knowledge and statistical correlation, we were able to discover that the features with the highest influence on catch success were related to the robot’s physical limits. In our third group, the feature groups whose accuracy performed the best consisted of position and velocity maximum values for the robot’s joints, a hardware limit on the robot. Finding this combination of features as the most informative features makes sense in the limitations of the robot: at joint and actuator limits, there may be error which is unnaccounted for in the throw path generation. Using only these features, we found a model with 84.48% accuracy with no tuning. After tuning the model parameters, it reached an accuracy of 85.71% on the training data with 10-fold cross validation. As the final step, we implemented our tuned neural network on the previously untouched testing data. This achieved an accuracy of 87.5%, outperforming both our goal and our expectation.
Analysis
The two main contributors to our achieved accuracy were algorithm selection and feature selection. Initially we expected a clustering algorithm to work well, as we thought the data might fall into distinct classification groups for certain features. We also though certain configurations might have a higher prior likelihood of success, which could be exploited through Bayes Nets. In practice, neither of these algorithms performed well. Only a multilayer perceptron neural net was able to map this high dimensional, nonlinear data set in a way that was able to distinguish the different classes. Within the neural net algorithm, we determined which features contributed most to accuracy. Pruning the dataset by removing unnecessary features was the key step in improving our accuracy.
In the future, the neural net model would be implemented in the control algorithm for the robot throwing task. After calculation of the release point and path, the features would be extracted and testing using the neural net model for catch success. If the catch is not predicted to be successful, the robot would calculate a new path. With the 87.5% accuracy we achieved on the test data, this would bring the catch success rate to 96.55%. In addition, this project treated the task as binary classification. Ideally, the robot should be able to accurately throw to any specified height and distance. This regression problem was beyond the scope of this task, but would be an enlightening experiment to better understand the uncertainty in the throwing task.